Toronto has seen a dramatic 54.8% drop in homicides year over year, along with an overall 9.5% decline in major crime indicators (MCIs) as of late December 2025.
According to Toronto crime statistics, violent crime rates have decreased across the board, with assaults (-2.8%), robberies (-18.7%), and sexual violations (-10.5%) all down. Property crime has also mostly declined, including a 25.5% decrease in auto thefts and an 11.3% decline in break and enter.
At Protection Plus, we’ve put together the most important Toronto homicide statistics to show where progress is being made, how the current numbers compare to previous years, and what these trends reveal about safety across the city.
1. There were roughly 85 murders in Toronto in 2024, but 2025 is on pace to decrease that number by more than half
As of Dec. 21, 2025, Toronto had reported 38 murders for the year, marking a 54.8% decline from the 84 murders recorded by the Toronto Police Service (TPS) during the same time period in 2024. By year-end 2024, the city saw 85 homicides.
The 2025 homicides to date included:
Second-degree murder: 16
First-degree murder: 14
Murder with intent: 3
Discharge firearm with intent: 2
Sudden death — suspicious: 2
Aggravated assault: 1
For comparison, there were 73 homicides reported in 2023 and 71 in 2022. A similar spike occurred in 2021, when 85 murders were also reported.
2. Toronto’s homicide rate is projected to fall to about 1.2 per 100,000 residents in 2025
Based on an estimated 3.3 million residents, there is about 1.15 homicide per 100,000population in Toronto as of late December 2025, with 38 recorded homicides. That is less than half the murder rate observed at the same point in 2024, when 84 homicides translated to approximately 2.55 per 100,000 residents.
The projected 2025 rate also comes in well below the 2.58 per 100,000 recorded by the end of 2024, when Toronto finished the year with 85 homicides.
If the city ends 2025 with 38 total homicides, it would mark the lowest homicide rate Toronto has seen in recent years, reflecting a significant year-over-year improvement in one of the most closely watched crime metrics.
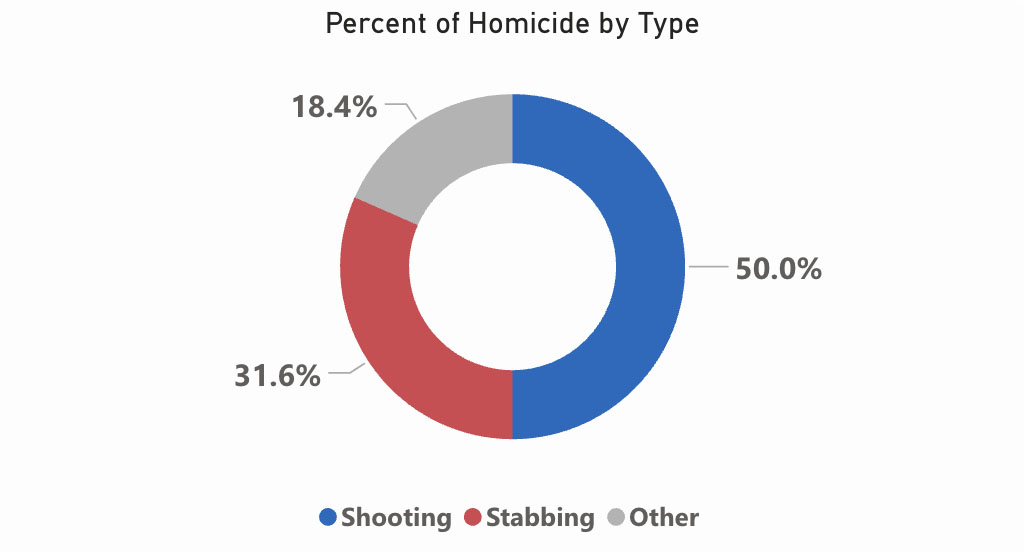
According to Toronto homicide statistics, by late December 2025 the city had seen 19 shooting deaths (55.8% decrease year-over-year), 12 stabbing deaths (47.8% decrease), and 7 murders with other weapons (61.1% decrease).
The previous year-to-date, there had been 43 shooting deaths, 23 stabbing deaths, and 18 murders with other weapons. By the end of 2024, one more stabbing death was recorded to bring the total to 24.
While 2025 is on track to beat all of these lows, 2023 previously saw the fewest shooting deaths in recent years with 29, and 2021 saw the fewest stabbing deaths and other homicides with 16 and 10, respectively.
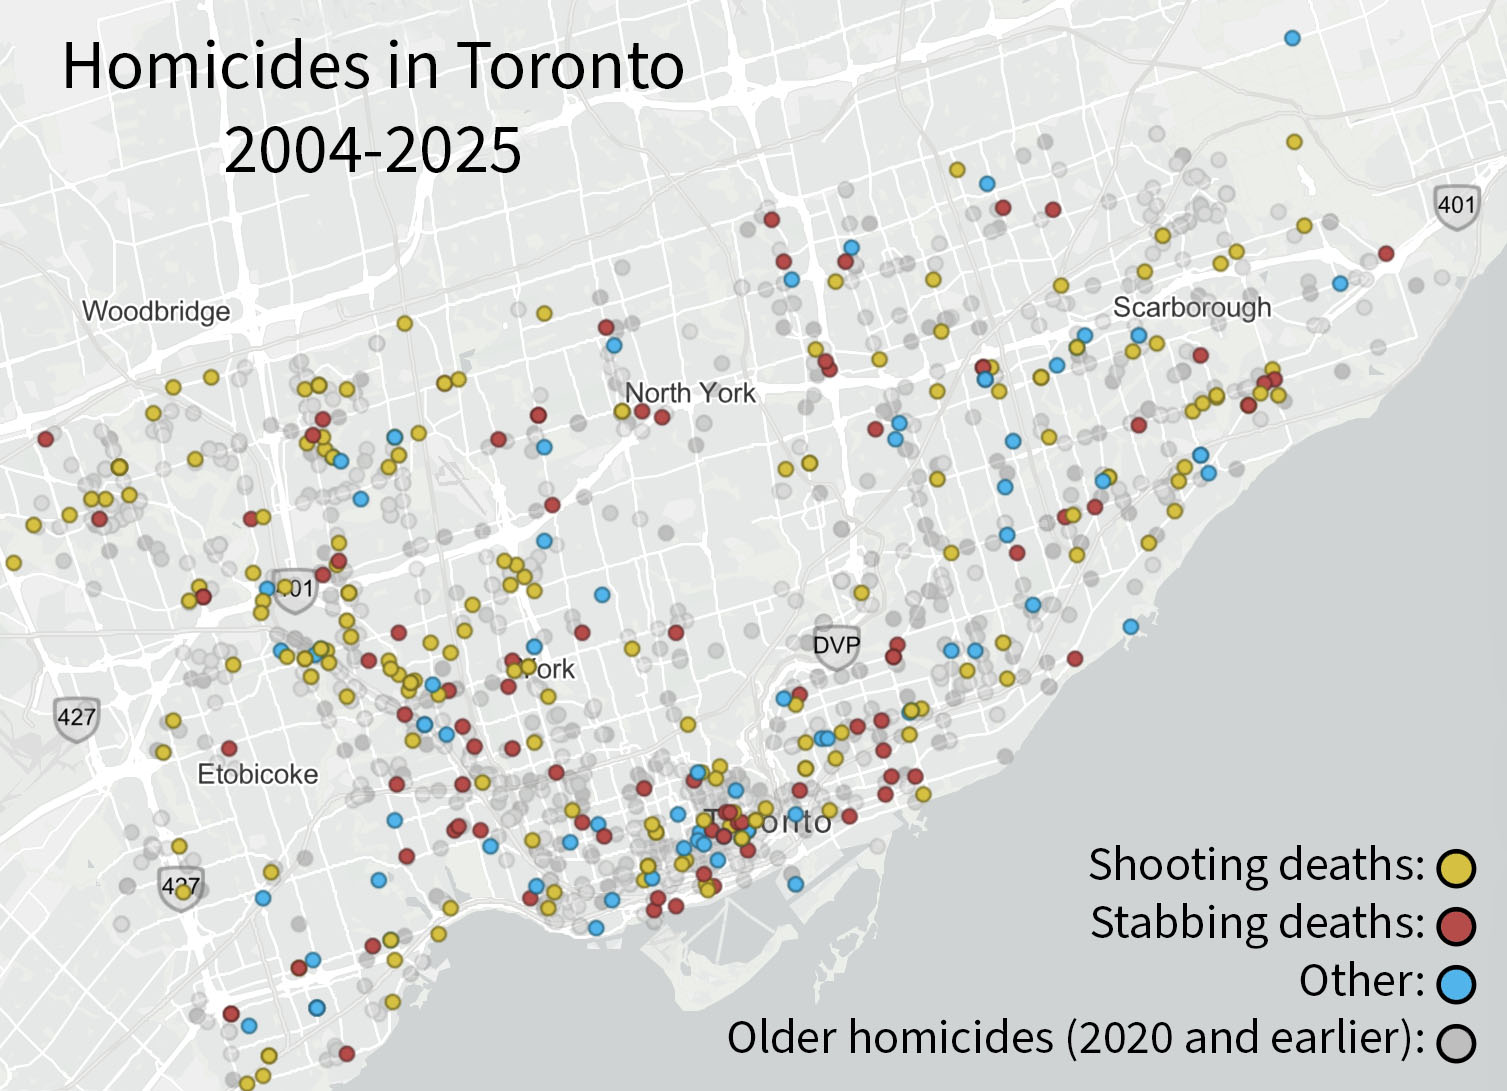
The map above indicates the location of every homicide reported in the city of Toronto for over more than two decades.
Colored markers reveal murders from 2021 to December 2025, with yellow markers indicating shooting deaths, red markers representing stabbing deaths, and blue markers indicating other murders. Grey markers indicate older homicides reported from 2004 through 2020.
5. By late December, 5 Toronto neighbourhoods had recorded 2 murders each in 2025
By late December 2025, five Toronto neighbourhoods had two police-reported homicides each — Annex, Bendale-Glen Andrew, North Riverdale, Wellington Place, and West Hill.
At the same point last year, five homicides had been recorded in Weston, more than any other neighbourhood. So far in 2025, Weston has recorded zero homicides for the year.
Toronto homicide statistics reveal that in 2023 Moss Park had the most murders with seven, while 2022 saw another five-way tie among Alderwood, Glenfield-Jane Heights, Lansing-Westgate, Moss Park, and York University Heights with three homicides each. In 2021, York University Heights led with six homicides.
Here’s the neighbourhood breakdown of the 38 homicides reported in Toronto as of December 2025:
6. Ontario as a whole did not reflect Toronto’s 2024 homicide spike — the provincial total increased by only 10
According to Statistics Canada, Ontario recorded 282 homicides in 2024 — an increase of 10 over the 272 homicides recorded in 2023. However, the 2024 total was still lower than in 2022 (293) and 2021 (284).
Likewise, the Ontario murder rate in 2024 was 1.75 per 100,000 population, only slightly higher than 1.74 the previous year and lower than 2022 (1.94) and 2021 (1.91). This was also lower than the national murder rate, as Canada saw a total of 788 homicides in 2024 (the fewest since 2020) with a murder rate of 1.91 per 100,000 population.
However, the 2024 Ontario homicide rate did show a 52.67% increase compared to 2014, while the nationwide homicide rate increased 28.82% over the decade. Data for 2025 is not yet available.
Here’s how the total number of homicides in Ontario compared to other provinces in 2024, as well as the homicide rate per 100,000 population:
7. Among Canadian CMAs, Toronto consistently ranks first for homicides, with 133 in 2024
Each year, the Toronto census metropolitan area (CMA) records more homicides than any other CMA. However, Toronto is the most populous Canadian CMA with over 7.1 million people, followed by Montreal (4.6 million) and Vancouver (3.1 million).
Before peaking at 133 homicides in 2024, the Toronto CMA recorded 119 in 2023, 131 in 2022, 118 in 2021, and 103 in 2020 — vastly surpassing all other CMAs each year.
The table below shows the 10 CMAs with the most homicides in 2024, as well as their estimated populations and homicide rates per 100,000 population:
An additional 270 murders were recorded in non-census metropolitan areas, the fewest since 2020.
Despite having the highest total number of homicides, Toronto’s 2024 rate (1.9) ranks seventh among these CMAs.
Winnipeg has the highest homicide rate among these CMAs at nearly 4.6 per 100,000.
Vancouver and Montreal have the lowest, both around 1.2 per 100,000.
8. Homicides tend to spike around the hottest months and September, while massive spikes can occur around the holidays
While trends since 2020 are inconsistent, there appears to be an annual spike around September and between June and July, with sometimes another during or just after the holidays, either in December (the highest month for murders in 2023, with 11) or January (the highest month for 2022, with 10).
As of December 2025, July and September were the heaviest months for homicide in Toronto, with six murders reported in each month. Five homicides were reported in June, while four were reported in both March and August. Three were reported in both February and April, two were recorded in both October and November, and one was reported in January, May, and December.
In 2024, June and September saw the highest spikes, with 11 and 10 homicides, respectively. The fewest homicides year-over-year occurred in May, July, and August, with six each. However, the lowest months for reported homicides by year-end were November with 4 and December with 5 murders.
9. As of December, the TPS had 3 current homicide investigations for 2025 — the lowest for any recent year
For comparison, Toronto Police Service Homicide has 17 current investigations from 2024, five from 2023, 11 from 2022, 22 from 2021, and 17 from 2020.
Current homicide investigations for 2025 include:
A 30-year-old male homicide victim, shot July 22 in the area of Osler Street and Davenport Road.
A 42-year-old male, shot May 19 in the area of Weston Road and Albion Road.
A 23-year-old man, shot March 26 near Martin Grove Road and Albion Road.
10. TPS cleared 84% of murder cases in 2022 — the highest clearance rate in 20 years
Of the 67 murders Toronto police investigated in 2022, they made 56 arrests by the end of that year.
Forty-two of these murders were fatal shootings, which are especially difficult to solve, but the department was able to clear 80% of them.
A success rate this high is very rare, and an inspector with the department credited video surveillance, forensic investigators, anonymous tips, and investigative genetic genealogy.
Data paints a cautiously optimistic picture for community safety in Toronto in 2026 and beyond. While fluctuations in Toronto homicide statistics are normal year to year, the trends below highlight meaningful progress toward a safer city:
Major decline in violent crime: The number of murders in Toronto is projected to fall by more than 50% compared to 2024, marking a strong improvement for this major Canadian city.
Record-low homicide rate: With a projected 1.2 homicides per 100,000 residents, Toronto’s 2025 homicide rate is on track to have the lowest murder rate in recent years.
Improved investigative outcomes: Over the past few years, the Toronto Police Service has seen the highest clearance rate in two decades, thanks to modern technology and strong community cooperation.
Encouraging long-term trend: The overall decline across most major crime indicators signals a potentially sustained positive shift in Toronto crime statistics.
How Protection Plus Can Help
These Toronto homicide statistics highlight the need for strong home security as well as business security. Since 1994, Protection Plus has helped Canadians safeguard what matters most. With over 25,000 homes and businesses served, our Toronto-based experts design and install tailored systems — from smart alarms to access control and video surveillance.
Whether you’re securing a home, rental, or commercial property, our 30+ years of local experience can help you feel safer and more confident. Contact us today for a free, no-obligation quote and see how Protection Plus can strengthen your peace of mind.
Protection Plus was absolutely incredible. The service they provide is next to none. I have done extensive research on security solutions and these guys know their stuff, do not oversell you, are a pleasure to deal with, and have great worksmanship. The assessment and install were easily arranged and completed. If you’re looking to reinforce security at your home, look no further, these guys are the best! Trust me, I would call them now!
T
Tony B.
Very efficient and fair. They were very professional and provided recommendations that fit our needs. The installation process was very quick and the service was very friendly. Highly recommend Protection Plus. Steve and John where extremely helpful. Thanks guys! Elio
E
Elio M.
Everyone from the Protection Plus team was amazing. The consultant took the time to come to my house to properly assess the scope of work and quote me accordingly. The 3 technicians sent to my house were so helpful and nice!! And the office staff was great as well throughout the billing process. I’ve already recommended Protection Plus to a friend and will continue to do so!