Anyone concerned with public safety — whether a homeowner, renter, business owner, or policymaker — should stay informed about crime trends in Toronto.
At Protection Plus, we’ve analyzed data from law enforcement, independent studies, and crime reporting to find 20 Toronto crime statistics you need to know. Understanding these stats will help you identify risks, improve home security, enhance business security, and keep you informed about criminal activity.
1. Homicides in Toronto plummeted roughly 55% in 2025
Following 85 reported murders in 2024, there have been 38 murders as of Dec. 21, 2025. For comparison, there were 73 homicides reported in 2023.
2. Assaults are the most common major crime in Toronto and continue to increase about 4% each year
Assaults represented about 54% of reported major crime indicators (MCIs) as of late December 2025, compared to 50.6% of MCIs by year end 2024. This follows a consistent increase, as assaults comprised about 46% of reported MCIs in 2023.
In 2024, there were a total of 4,564 assaults with a weapon and 1,075 assaults with bodily harm reported.
3. Toronto auto thefts fell 25.5% to 7,044, the lowest level since 2021
Auto theft remains a notable crime issue in Toronto, but its footprint has shrunk considerably in 2025. As of late December, police recorded 7,044 vehicle thefts, the lowest annual total since 2021 and a sharp decline from recent years.
Auto thefts also make up a smaller share of overall major crime. In 2025, the offence accounted for 15.6% of major crime incidents, down from 27.7% in 2023 when car theft dominated Toronto crime statistics.
For context, 9,598 auto thefts were reported in 2024, highlighting how much volumes have cooled in a single year.
4. Break-and-enter incidents fall to 5,927 in 2025, extending a multi-year decline
Break-and-enter reports continued to drop in Toronto in 2025, reinforcing a downward pattern seen since last year. By late December, police had recorded 5,927 incidents — down 13.6% from the same point in 2024 and the lowest annual total in several years.
The decline follows a meaningful reduction in 2024, when reports fell 10.2% year over year, dropping from 7,644 in 2023 to 6,860.
Taken together, the past two years indicate breaking and entering is becoming less frequent across the city, even as other property crimes fluctuate.
5. Sexual violations remain elevated but have declined 11.7% following a spike in 2024
There were 3,138 reported sexual violations in Toronto as of late December 2025, compared to 3,506 reports by the same time the previous year and 3,558 by year end.
This includes 2,574 reports of sexual assault to date in 2025, down from 2,820 reports during the same period the previous year.
In 2024, there were a total of 2,866 sexual assaults reported.
6. The surge in robberies since 2021 seems to be over, with robbery reports on track for the lowest levels since that year
By late December 2025, police recorded 2,531 robberies — putting the year on pace for the lowest total since 2021. That compares with 3,112 reports by the same point in 2024 (3,196 for the full year).
There were 3,043 and 2,853 over the same period in 2023 and 2022, respectively, suggesting the wave of robberies over the past few years has largely tapered off.
7. Theft over $1,000 rises to 1,960 incidents in 2025, bucking broader crime declines
While most major crime indicators fell in 2025, theft over $1,000 moved in the opposite direction. As of Dec. 21, police recorded 1,960 incidents, marking a 6.5% increase year over year and making it the only major crime category to rise during the year.
By the same point in 2024, there were 1,840 reports (1,872 by year end), while 2023 finished with 1,736 incidents.
Even as other property and violent crimes cooled in 2025, high-value theft continued to edge upward.
Toronto Crime Statistics and Trends — 5‑Year Breakdown
The following Toronto crime statistics are based on year-to-date reports from the TPS as of Dec. 21, 2025, with comparisons to the year-to-date in 2024 and crime trends since 2020.
8. Major crimes dropped 9.5% year over year, but total crimes have steeply risen over the past 5 years
Toronto saw a welcome decrease in major crimes in 2025. As of late December 2025, nearly all MCIs in the city had declined (except theft over $1,000) compared to the year-to-date in 2024, with 45,146 yearly reports to date versus 49,907 by the same month the previous year (51,006 total).
By comparison, there were only 37,926 MCIs reported in 2021.
9. There were roughly 3 murders per 100,000 residents in 2024 — but 2025 is on track to halve that number
As of late December 2025, there had been 38 murders reported in the city of Toronto, a steep decline of 54.8% over the 84 homicides reported during the same period the previous year. By the end of 2024, one more homicide was recorded, bringing the total to 85 homicides.
According to Statistics Canada, approximately one in seven shooting incidents nationwide are linked to tow-truck industry turf wars.
11. Robberies declined sharply in 2025, with reported incidents down 18.7% year over year
Toronto crime statistics show police logged 2,531 robberies by late December, compared with 3,112 during the same stretch in 2024.
Notably, fewer incidents involved weapons, as 694 robberies with a weapon were reported in 2025, down from 888 year-to-date in 2024 and well below the 912 recorded for all of last year.
12. Auto thefts surged more than 48% in 2022 before peaking in 2023
Toronto’s auto theft problem escalated rapidly in the early 2020s before showing signs of correction. The first major spike came in 2022, when reported vehicle thefts jumped 48.2% year to date, marking the beginning of a sustained surge across the city.
The crisis peaked in 2023, with more than 12,300 auto thefts reported by late December.
While thefts remained elevated in 2024, the decline seen in 2025 indicates the explosive growth that defined the past five years is easing, even if auto theft remains above pre-pandemic levels.
13. Break-and-enter activity remains relatively stable over five years despite a 2023 spike
Viewed over a five-year period, Toronto’s break-and-enter trends have been comparatively steady, with one notable disruption in 2023. That year saw the largest increase of the period, with year-end totals rising 25.27% over 2022 before retreating in subsequent years.
More serious cases have followed a similar arc. Reports of break-and-enter with intent to commit a crime peaked in 2024 at 971 incidents, then declined in 2025, with 842 cases reported by late December compared with 946 at the same point the year before.
While short-term fluctuations remain, the broader trend suggests break-and-enter levels have not experienced the same sustained escalation seen in other property crimes.
14. Theft over $1,000 shows a steady multi-year climb rather than a single-year spike
Unlike crime categories that surged and then corrected, theft over $1,000 has followed a gradual upward trajectory over the past several years. Annual totals rose from 1,736 incidents in 2023 to 1,872 in 2024, before continuing higher in 2025.
That trend was already visible mid-year. By August 2025, police had logged 1,118 incidents, up from 1,033 over the same period in 2024—a year-over-year increase of 8.4% at that point.
The pattern suggests persistent growth driven by cumulative pressure rather than a short-term surge.
15. By late December 2025, West Humber-Clairville had the most MCI reports for the second year in a row — with 1,153 vs. 1,322 year over year
Here are the 10 Toronto neighbourhoods with the most MCI reports in 2025, with the percentage of change since 2024:
West Humber/Clairville: 1,153 (12.8% decrease)
Mimico-Queensway: 1,124 (10.6% increase)
York University Heights: 915 (3.2% decrease)
Moss Park: 885 (3.4% decrease)
Yonge-Bay Corridor: 827 (3.4% decrease)
Downtown Yonge East: 790 (16.9% decrease)
NSA: 746 (0.5% decrease)
Kensington-Chinatown: 716 (13.6% decrease)
Wellington Place: 713 (5.9% decrease)
St. Lawrence — East Bayfront — The Islands: 670 (13.7% decrease)
16. Lambton Baby Point had the fewest MCIs for the second year in a row with 43 vs. 72 year over year
These 10 Toronto neighbourhoods saw the lowest MCI reports in 2025:
Lambton Baby Point: 43 (40.3% decrease)
Guildwood: 70 (17.6% decrease)
Blake-Jones: 88 (12.9% decrease)
Woodbine-Lumsden: 96 (10.3% increase)
Forest Hill South: 99 (27.2% decrease)
Maple Leaf: 100 (12.3% decrease)
Forest Hill North: 101 (7.3% decrease)
Humber Heights-Westmount: 103 (18.3% decrease)
Kingsway South: 103 (22.6% decrease)
Broadview North: 107 (25.2% decrease)
Violent Crime and Property Crime — Toronto and Ontario Ranked
A 2025 report from the Fraser Institute compares the rates of violent crime and property crime in Toronto and the Ontario census metropolitan area (CMA) to national crime trends.
Per 100,000 people in Toronto, there were just over 200 violent crimes from 2019–2020. This ranks Toronto higher than Canadian cities like Quebec and Ottawa, but lower than cities like Edmonton, Montreal, Calgary, and Vancouver.
Winnipeg has the highest rate of violent crimes, with roughly 670 offences per 100,000 population.
Meanwhile, Sherbrooke has the lowest rate, with a figure near 0.1%.
The national average is approximately 260 offences per 100,000 people.
Over the past 20 years, Ontario, which includes Toronto, has mostly maintained a rank of fourth in violent crime among Canadian CMAs.
Saskatchewan and Manitoba have consistently led in violent crime since 2004, with roughly 500 offences per 100,000 population in 2022.
Alberta and British Columbia also generally have higher rates of violent crime than Ontario, with BC dipping below Ontario from 2017 to 2018.
Generally, violent crime rates are lowest in Quebec and Atlantic Canada (AC). AC includes provinces Newfoundland and Labrador, Prince Edward Island, Nova Scotia, and New Brunswick.
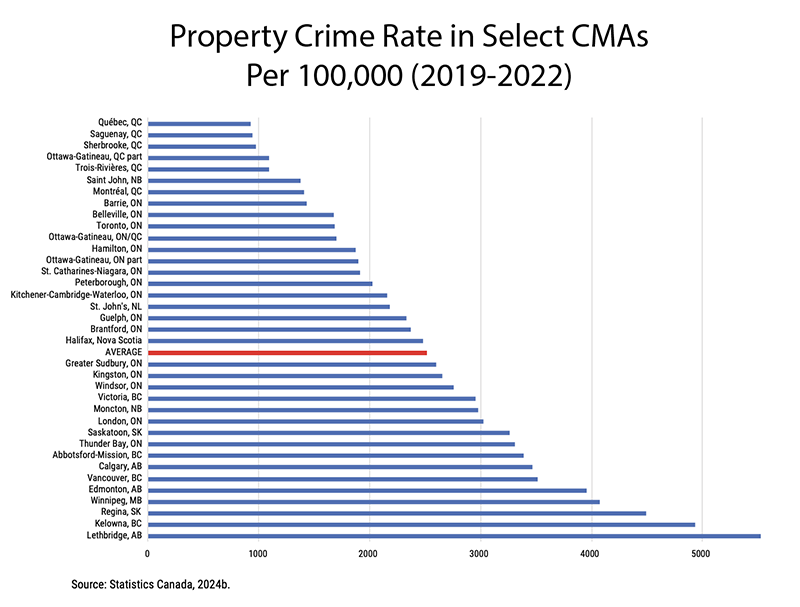
19. Toronto ranks 27th in property crime nationwide
In Toronto from 2019 to 2022, the property crime rate was roughly 1,750 per 100,000 population. This places Toronto higher than major cities like Quebec, Montreal, and Ottawa (Quebec), but lower than Ottawa (ON/QC), Halifax, Victoria, Calgary, Vancouver, and others.
The top three Canadian cities with the highest property crime rates are Regina, Saskatoon (5,500 per 100,000), Kelowna, British Columbia (4,900 per 100,000), and Lethbridge, Alberta (4,500 per 100,000).
The national average for property crime is approximately 2,500 per 100,000 population.
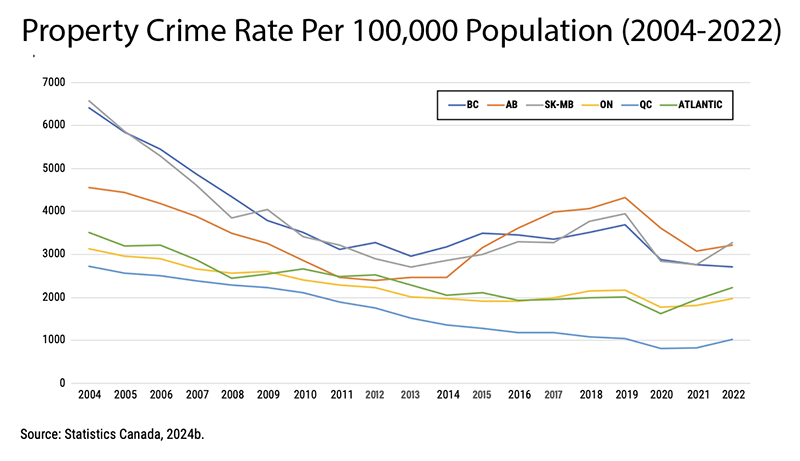
20. Ontario ranks 5th in property crime nationwide
Ontario, which includes Toronto, has long battled the Atlantic CMA to rank fifth in property crime, with the CMAs frequently switching places in the rankings over the past two decades. The Atlantic CMA includes the eastern provinces. The most recent data for Ontario shows a rate of about 2,000 property crimes per 100,000 population.
Saskatchewan and Manitoba are nearly tied with Alberta in property crime, leading the nation with roughly 3,200 offences per 100,000 population.
Property crime rates are lowest in British Columbia, with approximately 1,000 offences per 100,000 population.
What These Toronto Crime Statistics Reveal
Crime is cooling in key areas, but not evenly. Most major crime indicators declined in 2025, including homicides, robberies, auto thefts, and break-and-enters. These improvements suggest recent enforcement efforts and prevention strategies are having measurable impact across Canada’s largest city.
Violent crime is becoming more concentrated by type. Assaults now account for more than half of all major crime incidents, making them the dominant driver in Toronto crime metrics, even as shootings and homicides fall sharply year over year.
Property crime trends are diverging. While auto theft and break-and-enter incidents declined, theft over $1,000 continued to rise, standing out as the only major crime category to increase in 2025. This points to shifting offender behaviour rather than a uniform drop in risk.
Short-term gains sit atop long-term pressure. Although major crimes dropped nearly 10% in 2025, overall crime volumes remain well above early-2020s levels, underscoring the importance of tracking both snapshot data and five-year trends.
Toronto compares favourably nationally, but local risks remain. Crime rates in Toronto remain lower than many large Canadian CMAs, yet neighbourhood-level disparities show that risk varies widely depending on location.
How Protection Plus Can Help Protect Your Property
As Toronto crime rates continue to evolve, having the proper security measures in place is more important than ever. At Protection Plus, we’ve been helping Canadians protect what matters most since 1994. With over 25,000 homeowners and businesses served, our Toronto-based team brings decades of experience designing and installing customized systems — including smart alarms, access control, and video surveillance.
Whether you need protection for your home, rental property, or commercial space, we’re ready to help. Contact us today for a free, no-obligation quote and discover how our 30+ years of local expertise can help you feel safer.
Share us On:-
Allan Baum
Allan Baum founded Protection Plus with his wife Neseh in 1994. He has worked in the security industry since 1991. His educational background includes an MBA from York University ( when it was still York) and a B.A. from McGill. Allan and Neseh have three wonderful children who are now considered adults and an equally wonderful dog named Waub.
Protection Plus was absolutely incredible. The service they provide is next to none. I have done extensive research on security solutions and these guys know their stuff, do not oversell you, are a pleasure to deal with, and have great worksmanship. The assessment and install were easily arranged and completed. If you’re looking to reinforce security at your home, look no further, these guys are the best! Trust me, I would call them now!
T
Tony B.
Very efficient and fair. They were very professional and provided recommendations that fit our needs. The installation process was very quick and the service was very friendly. Highly recommend Protection Plus. Steve and John where extremely helpful. Thanks guys! Elio
E
Elio M.
Everyone from the Protection Plus team was amazing. The consultant took the time to come to my house to properly assess the scope of work and quote me accordingly. The 3 technicians sent to my house were so helpful and nice!! And the office staff was great as well throughout the billing process. I’ve already recommended Protection Plus to a friend and will continue to do so!