Anyone concerned with public safety — whether a homeowner, renter, business owner, or policymaker — should stay informed about crime trends in Toronto.
At Protection Plus, we’ve analyzed data from law enforcement, independent studies, and crime reporting to find 15 Toronto crime statistics you need to know. Understanding these stats will help you identify risks, improve home security, enhance business security, and keep you informed about criminal activity.
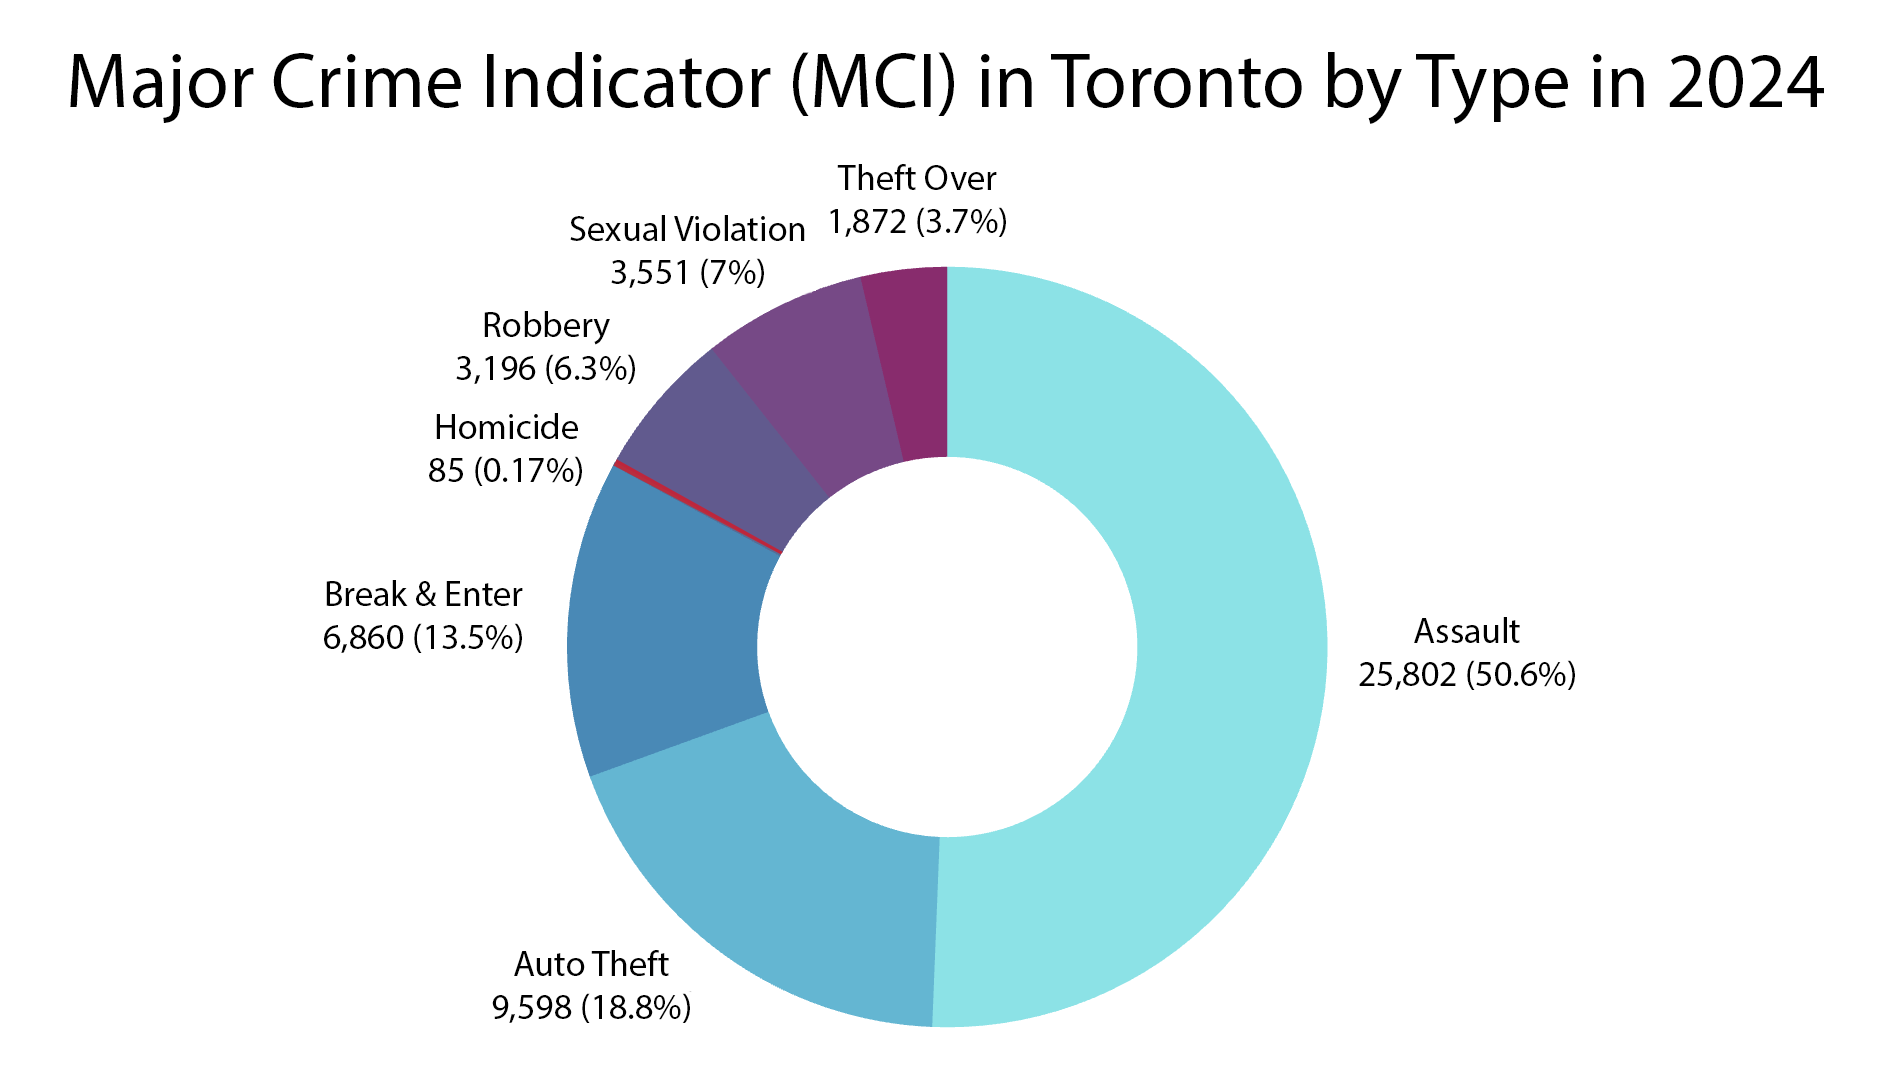
Homicide in Toronto skyrocketed in 2024, with 85 murders compared to 73 in 2023.
Assaults increased from 46.5% of reported major crime indicators (MCIs) in 2023 to more than half (50.6%) of reports in 2024.
Auto theft reports were the lowest since 2021, indicating relief from years of surging carjackings. With 9,598 reports in 2024, auto thefts fell from the peak of 12,515 (27.7% of all MCIs) in 2023.
Break-and-enter decreased from 7,644 reports in 2023 to 6,860 in 2024.
Sexual violations continue to go up, reaching 3,551 reports following a consistent rise since 2020.
The surge in robberies since 2021 is slowing, increasing slightly from 3,144 reports in 2023 to 3,196 in 2024.
Theft over $1,000 continues to climb, with 1,872 reports in 2024 compared to 1,736 in 2023.
Toronto Crime Statistics and Trends — 2025 Snapshot vs. 5‑Year Breakdown
The following Toronto crime statistics are based on year-to-date reports from the TPS as of August 2025, with comparisons to the year-to-date in 2024 and crime trends since 2020.
1. Major crimes drop 11.2% year-over-year, but total crimes have steeply risen over the past 5 years
Toronto is on track for a welcome decrease in major crimes in 2025. As of August, nearly all MCIs in the city have declined compared to the year-to-date in 2024, with 26,095 yearly reports to date versus 29,505 by the same month the previous year.
2. There were roughly 3 murders per 100,000 residents in 2024 — but 2025 is on track to halve that number
As of August 2025, there had been 23 murders reported in the city of Toronto, a steep decline of 56.6% over the 53 homicides reported during the same period the previous year. By the end of 2024, 85 homicides were recorded.
In 2021, Toronto saw a similar spike in the homicide rate, with 85 murders recorded that year.
3. Shooting incidents increased 33.6% to 461 in 2024, with 43 gun deaths
There were 43 deaths and 120 injuries in Toronto last year as shootings spiked from 345 in 2023 to 461 in 2024.
This represents a 48.3% increase in deaths year-over-year, but a 13.7% decrease in injuries.
2020 still holds the five-year high for shooting incidents with 462. There were 39 police-reported gun deaths that year and 178 injuries.
As of August 2025, there had been 160 shooting events (a 45.6% decrease), 12 gun deaths and 66 injuries.
According to Statistics Canada, approximately one in seven shooting incidents nationwide are linked to tow-truck industry turf wars.
4. Assaults in Toronto have slightly decreased in 2025 after climbing steadily since 2020
A total of 14,212 yearly assaults had been reported in Toronto as of August 2025, a 2.4% decrease from the same period in 2024. This is the first time assaults have decreased year-over-year during the reporting period.
This includes 2,451 assaults with a weapon so far in 2025 compared to 2,580 in the same time period the previous year.
There were a total of 4,564 assaults with a weapon reported in 2024.
As of August 2025, there have been 616 assaults with bodily harm reported, comparable to 623 reports filed by the same month the previous year.
In 2024, there were a total of 1,075 assaults with bodily harm reported.
5. Sexual violations have declined 15% so far in 2025, following the consistent upward trend over the past 5 years
Reports of 1,770 sexual violations had been received by the Toronto Police Service as of August 2025, compared to 2,088 by August 2024.
This includes 1,484 reports of sexual assault to date in 2025, down from 1,666 reports during the same period the previous year.
In 2024, there were a total of 2,866 sexual assaults reported.
6. Robberies have dropped 12.1% in 2025 after several years of growth
A total of 1,611 robberies had been reported by August 2025, compared to 1,838 year-to-date in 2024.
This includes 428 reports of robbery with a weapon so far in 2025, a decrease from 525 at the same point the year before.
In 2024, there were a total of 912 reports of robbery with a weapon.
7. Auto thefts have dropped by 33.8% in 2025, following explosive growth over the past 5 years
As of August 2025, theft of automobiles had fallen by one-third over the same time period in 2024, with 3,859 auto thefts reported versus 5,854 by that point the previous year. This is a hopeful sign considering Toronto’s carjacking epidemic.
The largest year-to-date spike occurred in 2023, with a massive 47.7% increase and 7,322 auto thefts reported by August of that year.
8. Break-and-enters are down 12.3% in 2025, with a generally stable 5‑year trend
There were 3,502 reports of breaking and entering by August 2025, compared to 3,999 reports by the same month the previous year.
This includes 499 reports of B&E with intent to commit a crime so far in 2025, a significant decrease from 554 by the same time in 2024.
The year-end total for reports of B&E with intent reached 971 in 2024.
Over the past five years, the largest spike in break-and-enters occurred in 2023, with year-end totals increasing 25.27% over 2022.
9. Theft over $1,000 has risen 8.4% in 2025 — the only MCI to increase
As of August, there had been 1,118 reports of theft over $1,000 for the year, compared to 1,033 over the same period in 2024.
Toronto Crime Statistics by Neighbourhood
TPS data reveals how Toronto neighbourhoods ranked in 2024 based on the number of MCI reports.
10. In 2024, West Humber/Clairville had the most MCI reports with 1,355, while Lambton Baby Point had the fewest with 72
Here are the 10 Toronto neighbourhoods with the most MCI reports in 2024, with the percentage of change since 2023:
West Humber/Clairville: 1,355 (14.1% decrease)
Mimico-Queensway: 1,054 (51.4% increase)
Downtown Yonge East: 978 (2.7% decrease)
York University Heights: 969 (12.8% decrease)
Moss Park: 933 (3% decrease)
Yonge-Bay Corridor: 879 (3.4% increase)
Kensington-Chinatown: 843 (4.2% increase)
St. Lawrence — East Bayfront — The Islands: 794 (14.1% increase)
Wellington Place: 774 (3.5% increase)
NSA: 764 (13.7% increase)
These 10 Toronto neighbourhoods saw the lowest MCI reports in 2024:
Lambton Baby Point: 72 (7.7% decrease)
Guildwood: 89 (11.9% decrease)
Woodbine-Lumsden: 91 (40% increase)
Blake-Jones: 105 (27.6% decrease)
Forest Hill North: 110 (41.5% decrease)
Caledonia Fairbank: 111 (10.5% decrease)
Avondale: 113 (1.8% increase)
Centennial Scarborough: 117 (1.7% decrease)
Maple Leaf: 117 (9.3% decrease)
Pleasant View: 120 (14.9% decrease)
11. MCI reports in Mimico-Queensway jumped 51% from 2023 to 2024, while reports in Forest Hill North fell 41%
These five Toronto neighbourhoods saw the most significant percentage increase in MCI reports from 2023 to 2024:
Mimico-Queensway increased 51.4% to 1,054.
Woodbine-Lumsden increased 40% to 91.
Yonge-Eglington increased 36.2% to 297.
Elms-Old Rexdale increased 32.6% to 183.
Humbert Heights-Westmount increased 30% to 130 reports.
These five neighbourhoods saw the most significant percentage decrease in MCI reports from 2023 to 2024:
Forest Hill North decreased 41.5% to 110.
Kingsway South decreased 40.6% to 136 reports.
Princess-Rosethorn decreased 39.5% to 141.
Forest Hill South decreased 38.8% to 137.
Leaside-Bennington decreased 35.7% to 146.
Violent Crime and Property Crime — Toronto and Ontario Ranked
A 2025 report from the Fraser Institute compares the rates of violent crime and property crime in Toronto and the Ontario census metropolitan area (CMA) to national crime trends.
Per 100,000 people in Toronto, there were just over 200 violent crimes from 2019–2020. This ranks Toronto higher than Canadian cities like Quebec and Ottawa, but lower than cities like Edmonton, Montreal, Calgary, and Vancouver.
Winnipeg has the highest rate of violent crimes, with roughly 670 offences per 100,000 population.
Meanwhile, Sherbrooke has the lowest rate, with a figure near 0.1%.
The national average is approximately 260 offences per 100,000 people.
Over the past 20 years, Ontario, which includes Toronto, has mostly maintained a rank of fourth in violent crime among Canadian CMAs.
Saskatchewan and Manitoba have consistently led in violent crime since 2004, with roughly 500 offences per 100,000 population in 2022.
Alberta and British Columbia also generally have higher rates of violent crime than Ontario, with BC dipping below Ontario from 2017 to 2018.
Generally, violent crime rates are lowest in Quebec and Atlantic Canada (AC). AC includes provinces Newfoundland and Labrador, Prince Edward Island, Nova Scotia, and New Brunswick.
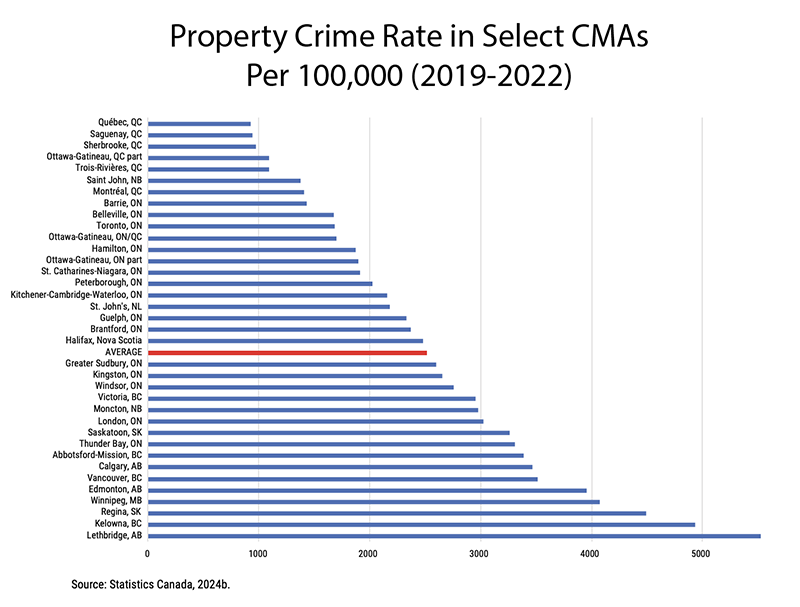
14. Toronto ranks 27th in property crime nationwide
In Toronto from 2019 to 2022, the property crime rate was roughly 1,750 per 100,000 population. This places Toronto higher than major cities like Quebec, Montreal, and Ottawa (Quebec), but lower than Ottawa (ON/QC), Halifax, Victoria, Calgary, Vancouver, and others.
The top three Canadian cities with the highest property crime rates are Regina, Saskatoon (5,500 per 100,000), Kelowna, British Columbia (4,900 per 100,000), and Lethbridge, Alberta (4,500 per 100,000).
The national average for property crime is approximately 2,500 per 100,000 population.
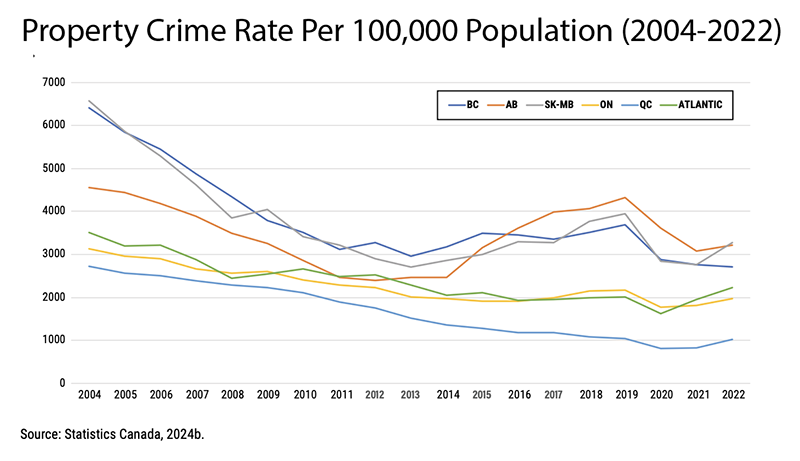
15. Ontario ranks 5th in property crime nationwide
Ontario, which includes Toronto, has long battled the Atlantic CMA to rank fifth in property crime, with the CMAs frequently switching places in the rankings over the past two decades. The Atlantic CMA includes the eastern provinces. The most recent data for Ontario shows a rate of about 2,000 property crimes per 100,000 population.
Saskatchewan and Manitoba are nearly tied with Alberta in property crime, leading the nation with roughly 3,200 offences per 100,000 population.
Property crime rates are lowest in British Columbia, with approximately 1,000 offences per 100,000 population.
What These Toronto Crime Statistics Reveal
Toronto crime statistics paint a picture of a city experiencing both progress and persistent challenges. While many major crime indicators are declining this year — including homicides, shootings, auto thefts, robberies, and break-ins — these drops follow several years of steady increases. This suggests that while short-term trends are promising, long-term vigilance remains essential.
At the neighbourhood level, datasets reveal extreme variation in crime rates from one part of the city to another, with double-digit increases or significant reductions.
Toronto continues to rank in the mid-range nationally for both violent and property crime, showing that Canada’s largest city isn’t immune to broader provincial or national crime trends.
These patterns reinforce the need for proactive security — especially in areas or categories where crime is still elevated.
How Protection Plus Can Help Protect Your Property
As Toronto crime rates continue to evolve, having the proper security measures in place is more important than ever. At Protection Plus, we’ve been helping Canadians protect what matters most since 1994. With over 25,000 homeowners and businesses served, our Toronto-based team brings decades of experience designing and installing customized systems — including smart alarms, access control, and video surveillance.
Whether you need protection for your home, rental property, or commercial space, we’re ready to help. Contact us today for a free, no-obligation quote and discover how our 30+ years of local expertise can help you feel safer.
Share us On:-
Allan Baum
Allan Baum founded Protection Plus with his wife Neseh in 1994. He has worked in the security industry since 1991. His educational background includes an MBA from York University ( when it was still York) and a B.A. from McGill. Allan and Neseh have three wonderful children who are now considered adults and an equally wonderful dog named Waub.
Protection Plus was absolutely incredible. The service they provide is next to none. I have done extensive research on security solutions and these guys know their stuff, do not oversell you, are a pleasure to deal with, and have great worksmanship. The assessment and install were easily arranged and completed. If you’re looking to reinforce security at your home, look no further, these guys are the best! Trust me, I would call them now!
T
Tony B.
Very efficient and fair. They were very professional and provided recommendations that fit our needs. The installation process was very quick and the service was very friendly. Highly recommend Protection Plus. Steve and John where extremely helpful. Thanks guys! Elio
E
Elio M.
Everyone from the Protection Plus team was amazing. The consultant took the time to come to my house to properly assess the scope of work and quote me accordingly. The 3 technicians sent to my house were so helpful and nice!! And the office staff was great as well throughout the billing process. I’ve already recommended Protection Plus to a friend and will continue to do so!